Viewing Processed Products
Browse Products
To access the processed products in the system, follow these steps:
-
Navigate to the Main Menu
Locate the header at the top of the screen. On the left side of the header, look for the Main Menu button, represented by three vertically stacked lines. -
Click the Main Menu Button
Click on the Main Menu button to reveal the main menu on the left side of the screen. -
Access the Products Menu
Within the main menu, find the "Products" button. -
Choose Processed Products
Click on the "Products" button to reveal a small dialog box with three options:- Processed Products
- Errored Products
- Archived Products
-
Select Processed Products
From the dialog box, click on the "Processed Products" option.
Data Grid
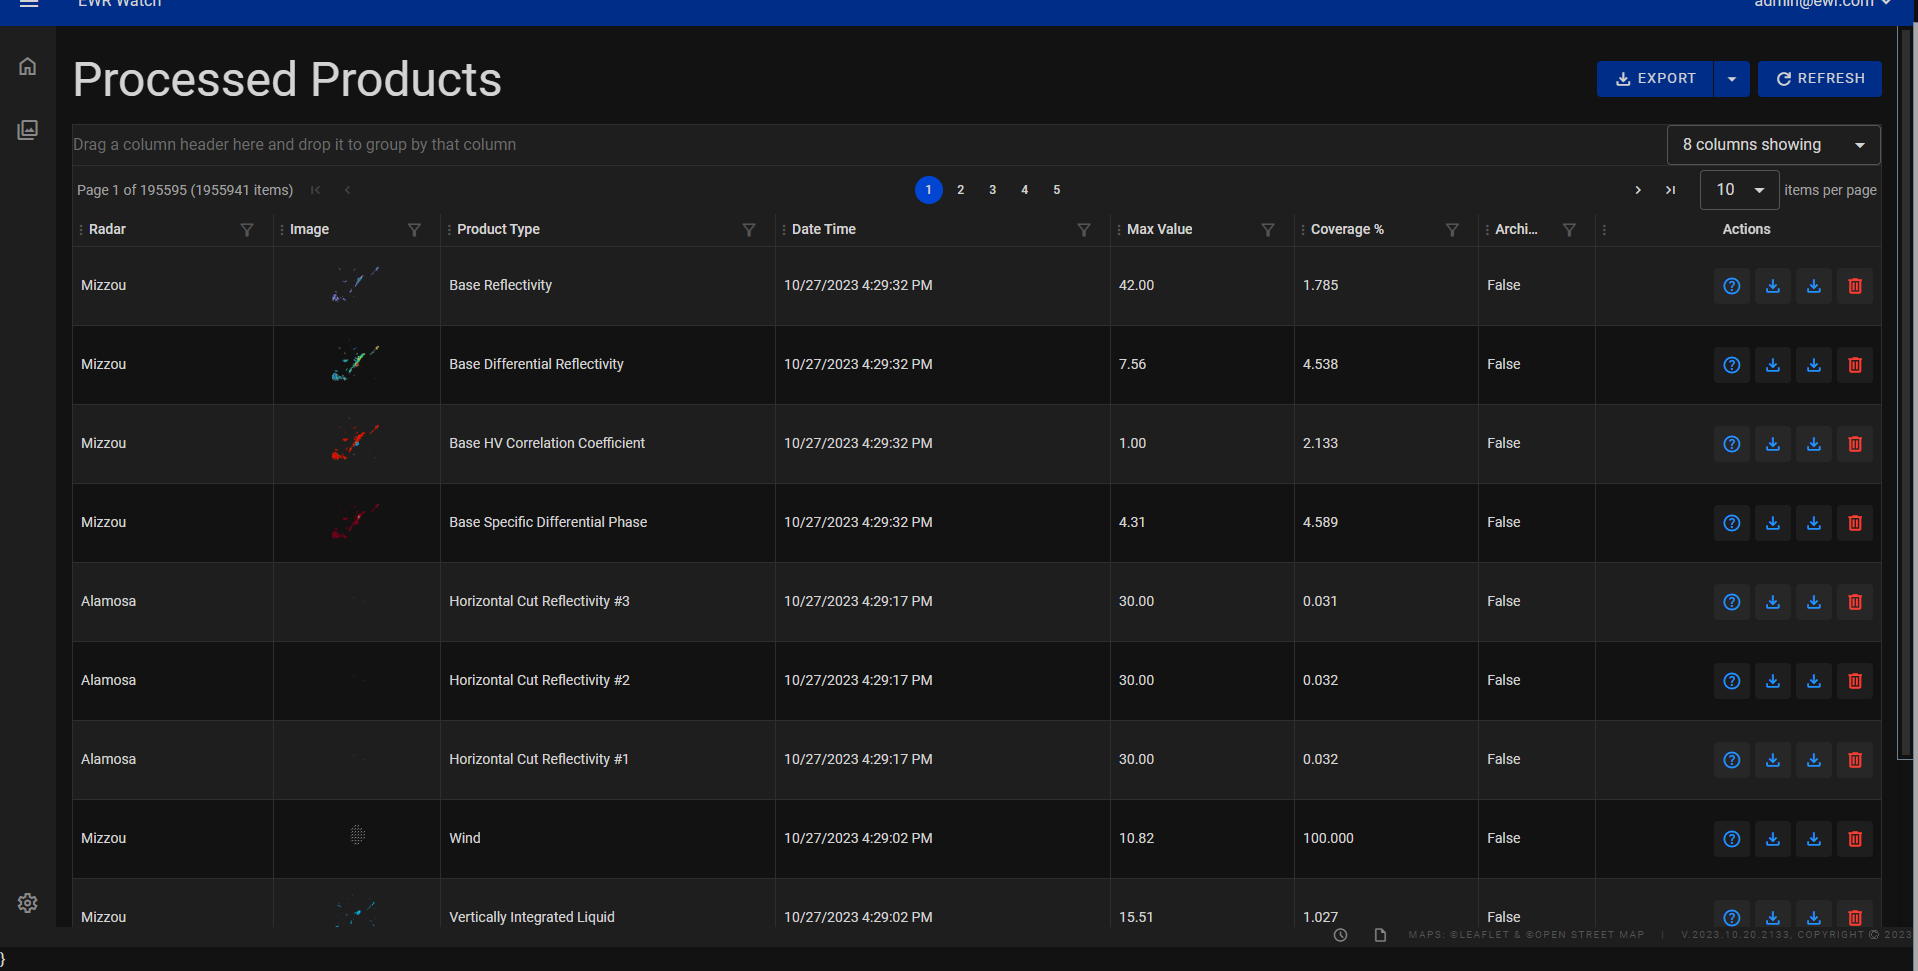
The processed products grid area consists of eight columns: Radar, Image, Product Types, Date Time, Max Value, Coverage Percentage, archived, and actions. below in the columns section each column has a detailed explanation
Columns
-
Radar
The Radar column contains the name of the radar systems used for data acquisition or observation for the rows product. -
Image
The Image column displays the image associated with the radar product. When clicked an enlarged image will appear. Images provide a visual context to the radar data, aiding in the analysis and interpretation of the information. -
Product Type
The Product Type column categorizes the type of data product generated by the radar system. Different radar applications produce various types of products, such as Base Reflectivity, Base Mean Radial Velocity, Base Differential Reflectivity and many more product types. This column helps users identify the specific kind of information represented in the dataset. -
Date Time
This column displays the date and time when the radar data was processed. It provides a chronological reference, enabling users to track changes or patterns in the data over time. The date and time information is crucial for time-sensitive analyses and historical comparisons. -
Max Value
This column represents the maximum value or measurement recorded by the radar system. Depending on the context, this could indicate the highest intensity, speed, size, or any other parameter relevant to the specific application of the radar technology. The maximum value provides insights into the extreme conditions observed in the dataset. -
Coverage Percentage
This column indicates the percentage of the total area or volume covered by the radar observations. Radar systems have limitations in terms of coverage due to factors like range, beam width, and obstructions. This column helps users assess the comprehensiveness of the dataset and understand the spatial limitations of the radar observations. -
Archived
This column contains a indicator (such as 'True' or 'False') to denote whether the data entry is archived or not. Archived data is typically stored for historical or reference purposes and is no longer actively used or updated. This column helps users distinguish between current, active data and older, archived records, ensuring that they are working with the most recent and relevant information.
Sorting & Filtering
Many data grids support advanced features such as resizing, multi-column sorting, filtering and more. See the Sorting and Filtering Grids in the manual for more information.
Now, you can view and manage the processed products within the system. This structured navigation ensures a seamless experience for users to access and monitor the status of processed products efficiently.
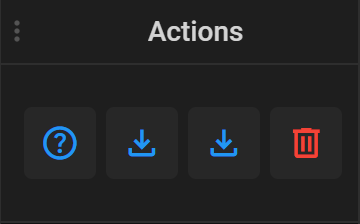
Actions
-
Description
The Description button serves as a vital tool for users to access detailed information about a specific product. When clicked this button opens a comprehensive overview, providing users with in-depth product data.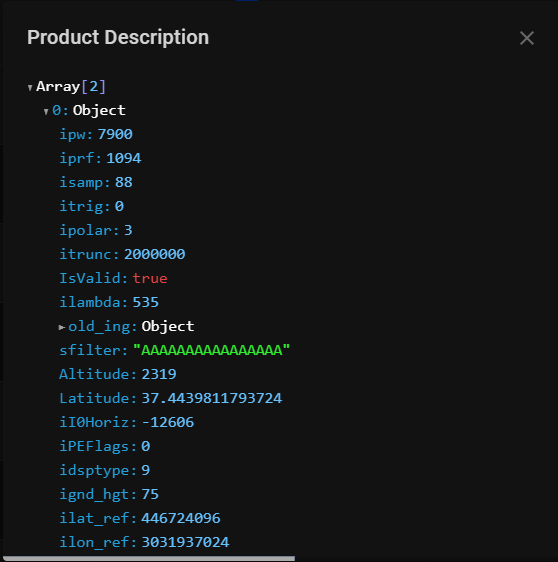
-
Download Image
The Download Image button enables users to download the visual output associated with the radar product. Clicking this button initiates the download process, allowing users to save the image locally on their devices for further analysis, presentation, or documentation purposes. -
Download Product
When users click on this button, it enables them to download product files associated with a particular product. This feature is particularly valuable for products that require additional documentation or analysis. -
Delete
The Delete Product button is a fundamental administrative tool used to remove radar products and help clean up the menu. Authorized users, such as administrators can click on this button to remove a product from the system's database. The Delete Product button ensures proper management of inventory, and helps maintain an organized and up-to-date products. It plays a crucial role in streamlining operations and ensuring the accuracy of available products.
Exporting
Allows users to export the current Radar list in two formats: CSV (Comma-Separated Values) and Excel. This feature facilitates easy data sharing and analysis by providing options suitable for various applications.