Reading the Color Legend

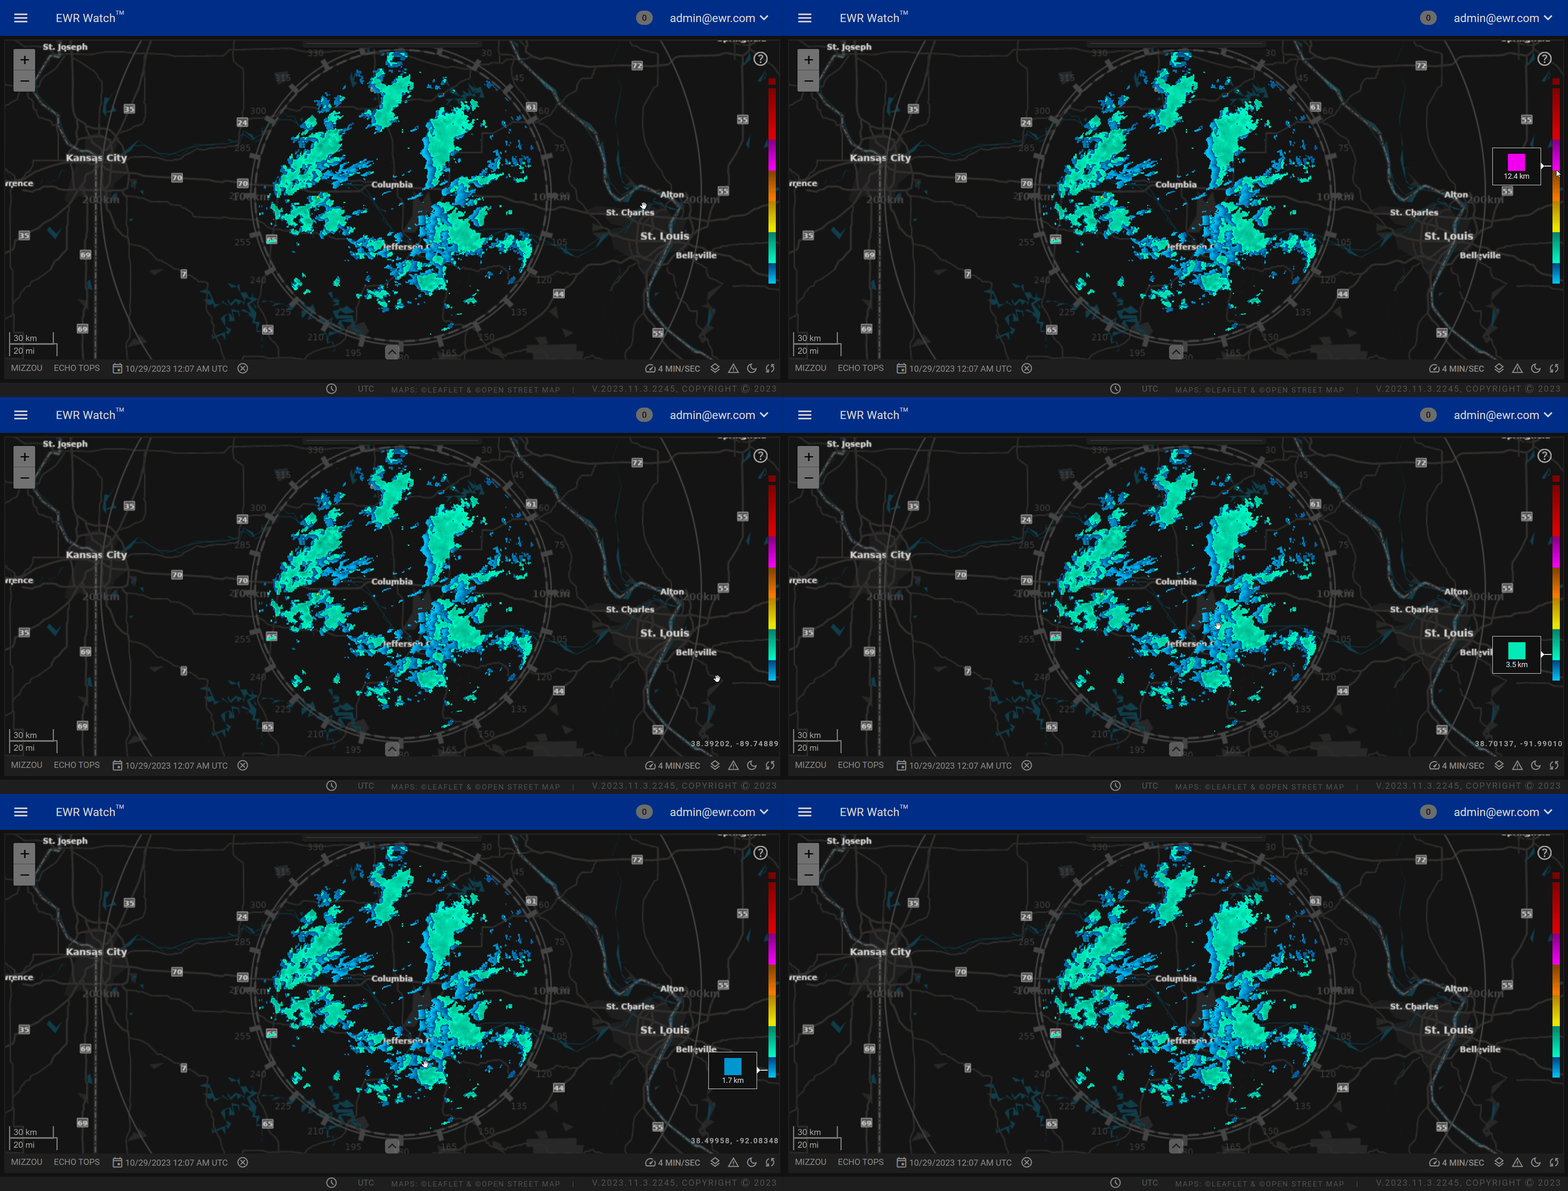
The interactive radar data visualization feature enhances the user experience by providing a dynamic color legend. When hovering over radar data points, a small box dynamically displays the corresponding value on the color legend. This real-time feedback mechanism empowers users to quickly interpret and analyze data, making the visualization process more intuitive and efficient.
Dynamic Legend
-
Hover Interaction
Users can hover over radar data to trigger the dynamic color legend display. The system responds in real-time, updating the small box on the color legend to show the value associated with the hovered data point. -
Real-Time Feedback
The dynamic color legend ensures immediate feedback, allowing users to effortlessly correlate radar data values with their corresponding color representations. This feature enhances the interpretability of the visualization, enabling users to make informed decisions based on the displayed data. -
Compact Display
The small box on the color legend provides a concise and non-intrusive display, avoiding clutter on the interface. Users can seamlessly navigate through the radar while obtaining precise information from the dynamically updated legend. -
Customization Options
The dynamic color legend feature is designed to be customizable, allowing users to adjust the appearance and behavior according to their preferences. Users can modify the colors, measurements, and other parameters to suit their specific needs.
Incorporating the dynamic color legend into your radar data visualization workflow adds a layer of interactivity that enhances user engagement and facilitates a more insightful analysis of the presented information.