Adding Custom Map Data
The Map Layers configuration page provides a detailed interface for managing radar data visualization within your application. This page consists of nine columns: Name, Description, File Name, Type, Min Scale, Max Scale, Enabled, Order, and a set of action buttons. Here's a breakdown of each column and its functionality.
Data Grid
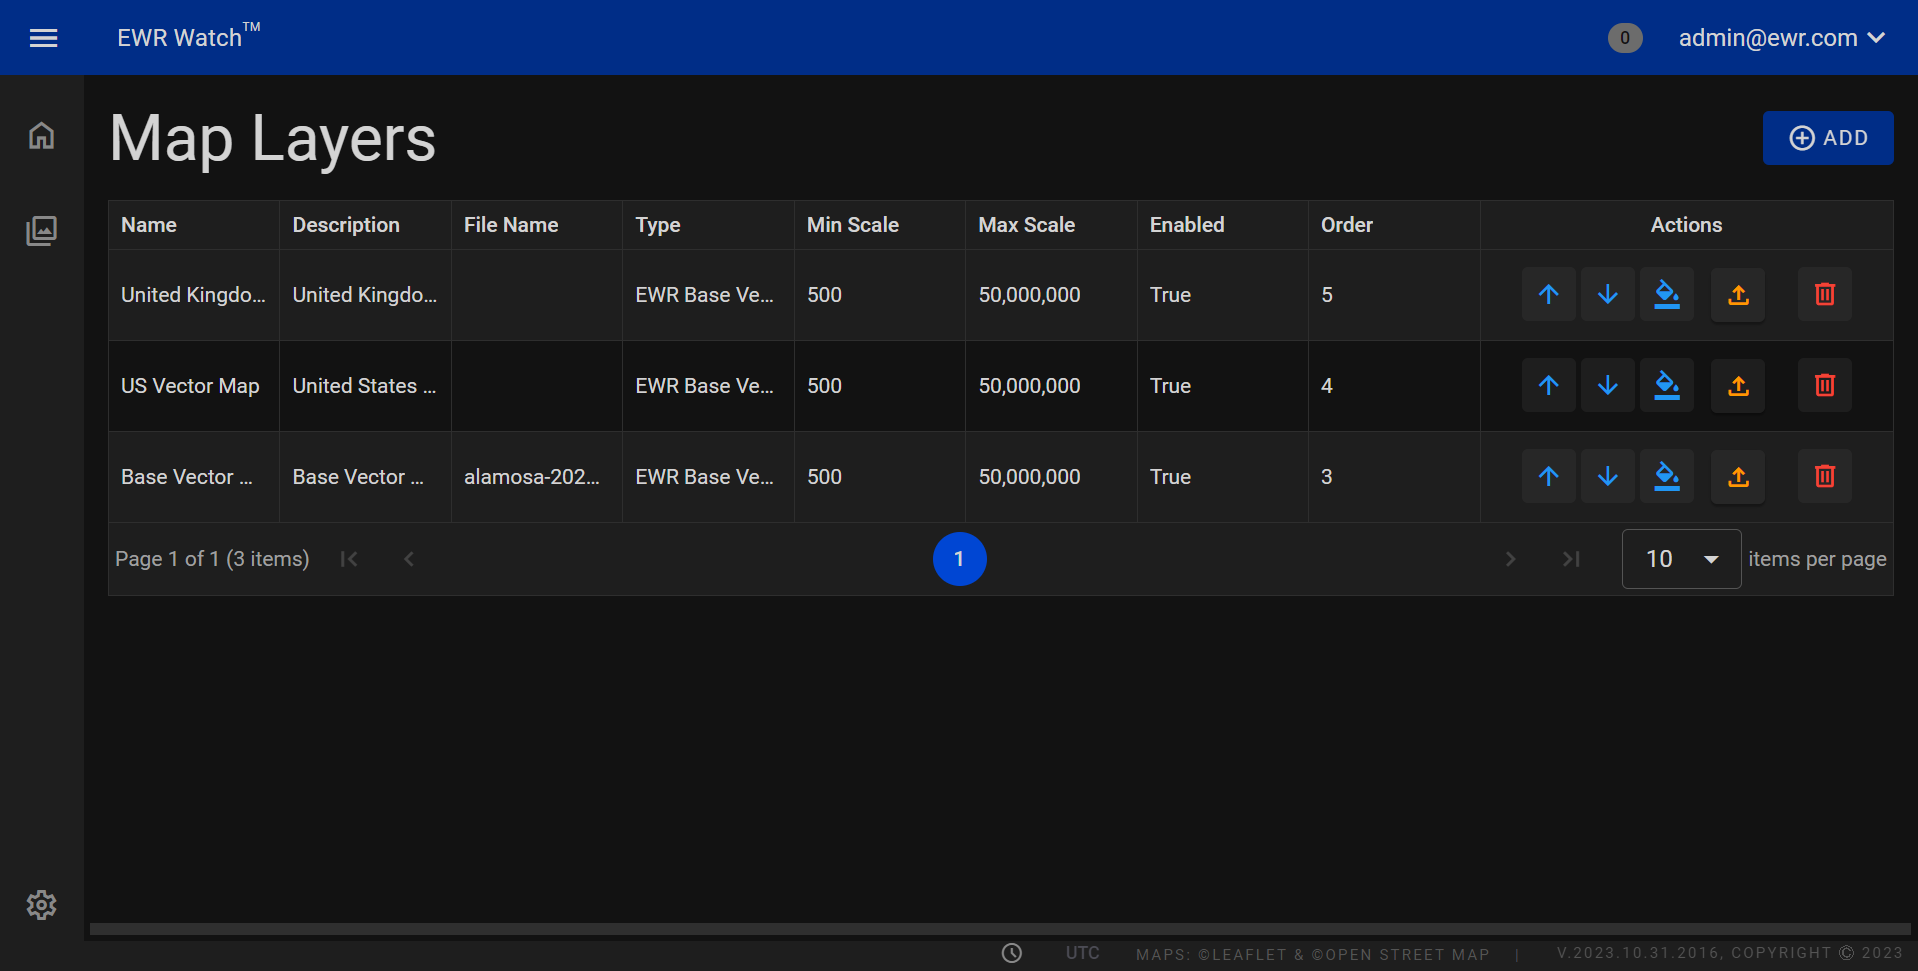
Columns
-
Name
Displays the name of the map layer, providing users with a clear identification of each layer. -
Description
Provides a brief description of the map layer, offering additional context or information about the layer's purpose or content. -
File Name
Indicates the file name associated with the map layer, aiding users in locating the source data file or reference. -
Type
Specifies the type of data represented by the map layer, such as geographical, weather, or terrain data, ensuring accurate interpretation. -
Min Scale
Defines the minimum scale at which the map layer becomes visible, allowing users to control layer visibility based on zoom levels. -
Max Scale
Sets the maximum scale at which the map layer remains visible, ensuring optimal data presentation at different zoom levels. -
Enabled
Indicates whether the map layer is currently enabled (visible) or disabled (hidden) within the application's interface. -
Order
Displays the order in which the map layers are rendered, enabling users to prioritize layers for effective visualization. -
Actions
The actions column has five action buttons: Move Up, Move Down, Edit Styles, Upload, and delete. These buttons will be explained down below in the Actions section.
Actions

-
Move Up
The move up button moves the selected map layer up in the rendering order, changing its priority in the visualization stack. -
Move Down
The move down button moves the selected map layer down in the rendering order, adjusting its position relative to other layers. -
Edit Styles
Clicking this will bring you to the layer styles page. The Layer Styles page Allows users to customize the visual styles and appearance of the map layer, ensuring a tailored and visually appealing representation. -
Upload
The upload button enables users to upload new data or files to update the map layer, facilitating real-time data integration. -
Delete
The delete button removes the map layer from the configuration, decluttering the interface and simplifying the visualization options.
Adding
When adding a map layer, a user-friendly interface will guide you through the customization process. The following options are available in a convenient box format:
-
Name
Input a descriptive and recognizable title for your map layer. -
Description
Provide additional context or details about the map layer to enhance understanding. -
Type
Specify the kind of data you're adding to the map, ensuring accurate representation. -
Min Value and Max Value
Set the numerical range for the data displayed on the map, creating a visual scale. -
Enable/Disable Checkbox
Use the checkbox to enable or disable the map layer. When checked, the layer is visible on the map; when unchecked, it is removed from the view until re-enabled.
Editing
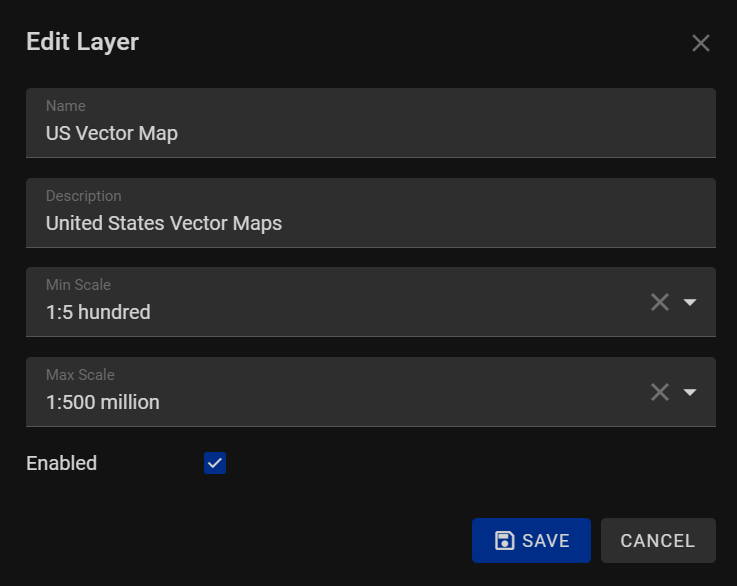
The Editing Layers Menu provides users the ability to enhance their mapping experiences. This menu is designed to empower users by allowing them to fine-tune various aspects of their layers, ensuring precise control over their maps. Within this menu, users can seamlessly modify the following attributes:
-
Name
Users can effortlessly edit the names of their layers, enabling them to create meaningful and descriptive labels for different elements within their maps. Clear and concise naming ensures better organization and understanding of the displayed data. -
Description
The Description field allows users to provide detailed context and information about the layers they are working with. A well-crafted description helps in communicating the purpose and significance of the layer, aiding collaboration and understanding among team members or stakeholders. -
Minimum Scale
The Minimum Scale parameter empowers users to set the minimum level of zoom at which the layer will be visible on the map. This feature is invaluable for refining the map's appearance at different zoom levels, ensuring that data is presented optimally without cluttering the view with unnecessary details. -
Max Scale
Similarly, the Max Scale parameter allows users to establish the maximum zoom level at which the layer will be visible. By defining an upper limit, users can maintain the map's readability and performance, particularly when dealing with intricate or densely populated layers.