Grid Sorting & Filtering
Sorting & Grouping
Efficiently manage and organize your data with the powerful sorting and filtering capabilities integrated into our grid system. Whether you're dealing with extensive datasets or complex information, our user-friendly interface allows you to effortlessly tailor the display of your information for optimal usability.
Sorting Columns
To sort data in a column, simply locate the three vertically stacked dots positioned to the left of the column name. Click and drag these dots into the desired position to instantly rearrange the data in ascending or descending order. This intuitive method provides a seamless experience, enabling you to prioritize information based on your specific requirements.
Show & Hide Columns
The ability to customize column visibility is a powerful feature in [Your Program Name], allowing users to tailor their data view to specific preferences and requirements. By selectively showing or hiding columns, users can focus on the information that matters most to them. This guide provides step-by-step instructions on how to utilize the "Columns Showing" feature, conveniently located in the top-right corner under the export and refresh buttons.
Instructions
-
Locate the "Columns Showing" Check Box List
- Navigate to the top-right, the Columns Showing check box is situated conveniently under the export and refresh buttons.
-
Activate the "Columns Showing" Check Box List
- To initiate the column customization process, click on the "Columns Showing" check box list. This action will reveal a list of all available columns.
-
Select Columns to Show or Hide
- A list of available columns will be displayed, each accompanied by a corresponding check box.
- Check the boxes next to the columns you want to show or uncheck those you wish to hide.
- The changes take effect in real-time, providing an immediate preview of the adjusted data view.
-
Apply Changes
- After selecting the desired columns, click on the "Apply" or "Save" button to confirm your choices.
- The system will seamlessly update the display, reflecting the newly configured column visibility settings.
Items Per Page
The Items Per Page dropdown list is a user-friendly and customizable feature designed to enhance the viewing experience within the program interface. This dropdown empowers users to tailor the number of displayed items on a single page, providing flexibility and control over their data presentation.
How to Use
- Locate the "Items Per Page" dropdown on the program interface.
- Click on the dropdown to reveal the available range of options.
- Select the desired number of items per page based on your preferences.
- The program interface will dynamically adjust to display the chosen number of items on each page.
Grouping Columns
To group columns, drag and drop them into the designated area above the columns. This feature allows you to group related columns together, facilitating a more structured and comprehensible view of your data.
Whether you're working with financial figures, project timelines, or any other type of information, the sorting and grouping functionalities empower you to customize your grid display, optimizing your workflow and enhancing your overall user experience. Enjoy the flexibility and precision of data manipulation within our intuitive grid system.
Filtering Columns
-
Accessing the Filter
Locate the funnel icon situated to the right of the desired column name. Click on the icon to initiate the filtering process. -
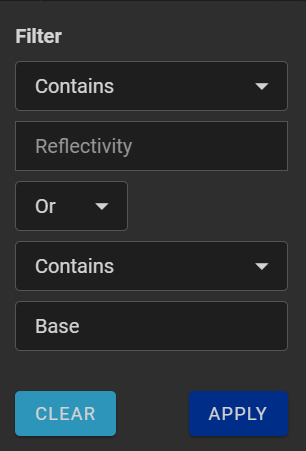
Filter Options
A popup box will appear, offering various filtering options. The first option is the "Filter options" dropdown menu, users can choose from the following conditions:- Equals
- Not Equals
- Contains (default)
- Starts with
- Ends with
- Does not Contain
- Is Null
- Is Empty
-
Setting Filter Condition Below the "Filter Options" dropdown, users will find a text entry box where they can input the text item to be filtered based on the chosen filter option.
-
Additional Filter Options
-
Condition List
Users can specify relationships between multiple items using the "Condition List" box, offering these options "And" and "Or." -
Secondary Filter Options
This section replicates the initial filter options, providing users the flexibility to apply a secondary filter condition. Users can choose from the same set of conditions mentioned above and enter the corresponding text for the second filter.
-
-
Executing the Filter
If the three additional boxes (Condition List, Secondary Filter Options, and Second Filter Item) are left blank, the filter will apply based on the conditions set in steps 2 and 3. Then click apply and the filter will activate.
By incorporating these intuitive filtering capabilities, [Program Name] empowers users to efficiently sift through data, facilitating a more targeted and personalized data analysis experience.