Process Viewer
Welcome to the Processor Viewer, an essential tool for tracking and understanding the intricate processes running within your system. This intuitive interface provides real-time insights into the operations of your program, aiding in efficient management and troubleshooting. Here's a detailed overview of the Processor Viewer page.
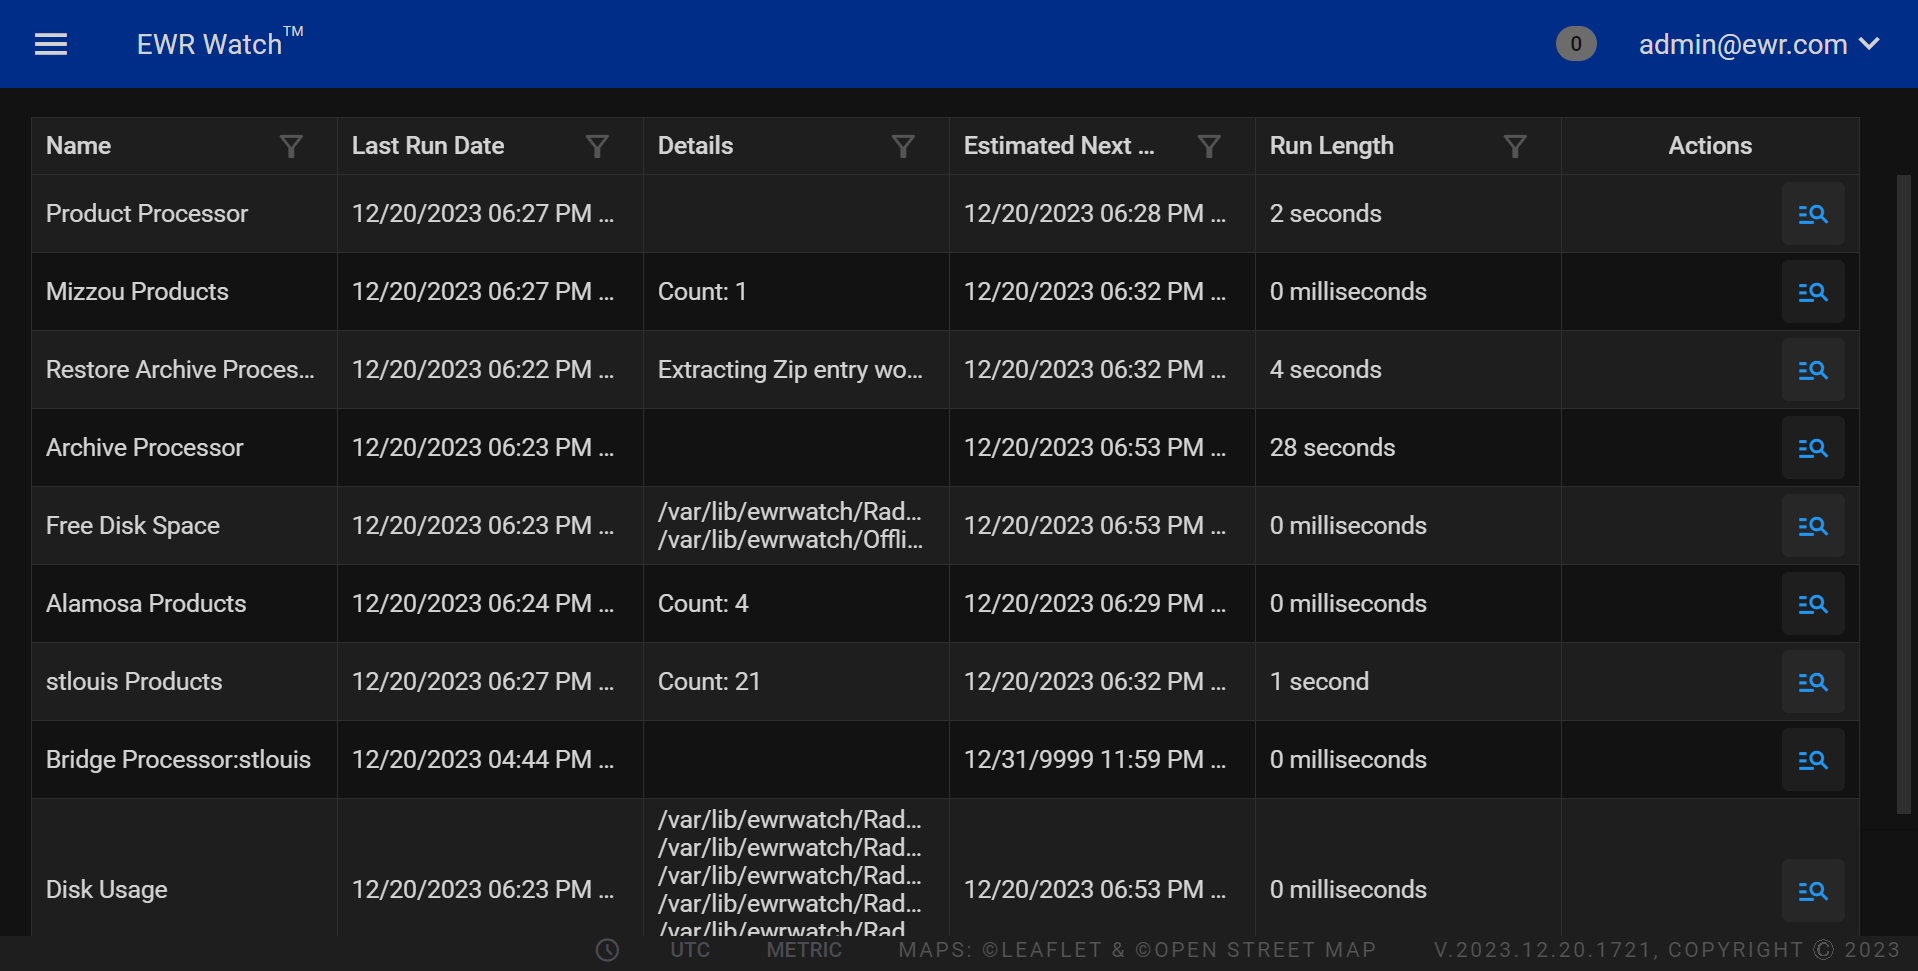
Process Information
Date and Time Stamp
The timestamp format follows the pattern "MM/DD/YYYY HH:MM:SS" to precisely record when each process event occurs.
Processor StartCore
Indicates the initiation of a processor core, marking the beginning of a specific processing task.
Arguments
Displays the detailed parameters and options associated with the process. In the provided example, the arguments are "/var/lib/ewrwatch/Radars -multithreaded," offering transparency into the configuration of the running task.
Streamlined Monitoring
The Processor Viewer ensures a streamlined and user-friendly experience, allowing you to effortlessly track multiple processes concurrently.
Actionable Insights
Gain actionable insights into your system's functionality by observing the sequence of processes and their respective arguments.
Efficient Troubleshooting
Use the Processor Viewer to troubleshoot issues promptly by identifying potential errors or irregularities in the sequence of processes.
Multithreading Support
The displayed example includes the "-multithreaded" flag, showcasing the support for multithreading capabilities within your program.
Enhance System Performance
Leverage the Processor Viewer to optimize system performance by identifying resource-intensive processes and ensuring they are running smoothly.
Real-time Updates
Enjoy real-time updates on your system's processes, empowering you to make informed decisions and maintain peak performance.
Incorporate the Processor Viewer into your toolkit for a comprehensive understanding of your program's inner workings. Efficiently monitor, analyze, and optimize processes with this indispensable feature, ensuring a smooth and responsive computing experience.
Actions
Stop Button
The Stop button is a crucial control within the program, designed to halt the reporting of processes effectively. When activated, this button interrupts the ongoing process reporting mechanism, providing users with the ability to temporarily suspend the flow of real-time updates. This feature is particularly useful when there is a need to pause monitoring activities, allowing users to focus on specific tasks without the distraction of continuous process updates.
Usage
-
Click the Stop button to halt the reporting of processes.
-
To resume reporting, users can click the Start button or equivalent functionality.
Clear Button
The Clear button is a handy tool for maintaining a clutter-free and organized workspace. When activated, this button clears the message log reports, providing users with a clean slate to monitor and analyze new processes. This functionality is instrumental in streamlining the interface and ensuring that users can easily distinguish between different phases of operation.
Usage
-
Click the Clear button to remove all existing message log reports.
-
This action enhances visibility and makes it easier to focus on new processes without the interference of historical data.