Legend Items
The Legend Items Page is a powerful feature within our application that allows users to manage and customize the display of data on their radar products. This page provides a comprehensive data grid interface with intuitive controls to enhance the visualization of information. Here's a breakdown of the key components and functionalities available on the Legend Items Page:
Data Grid
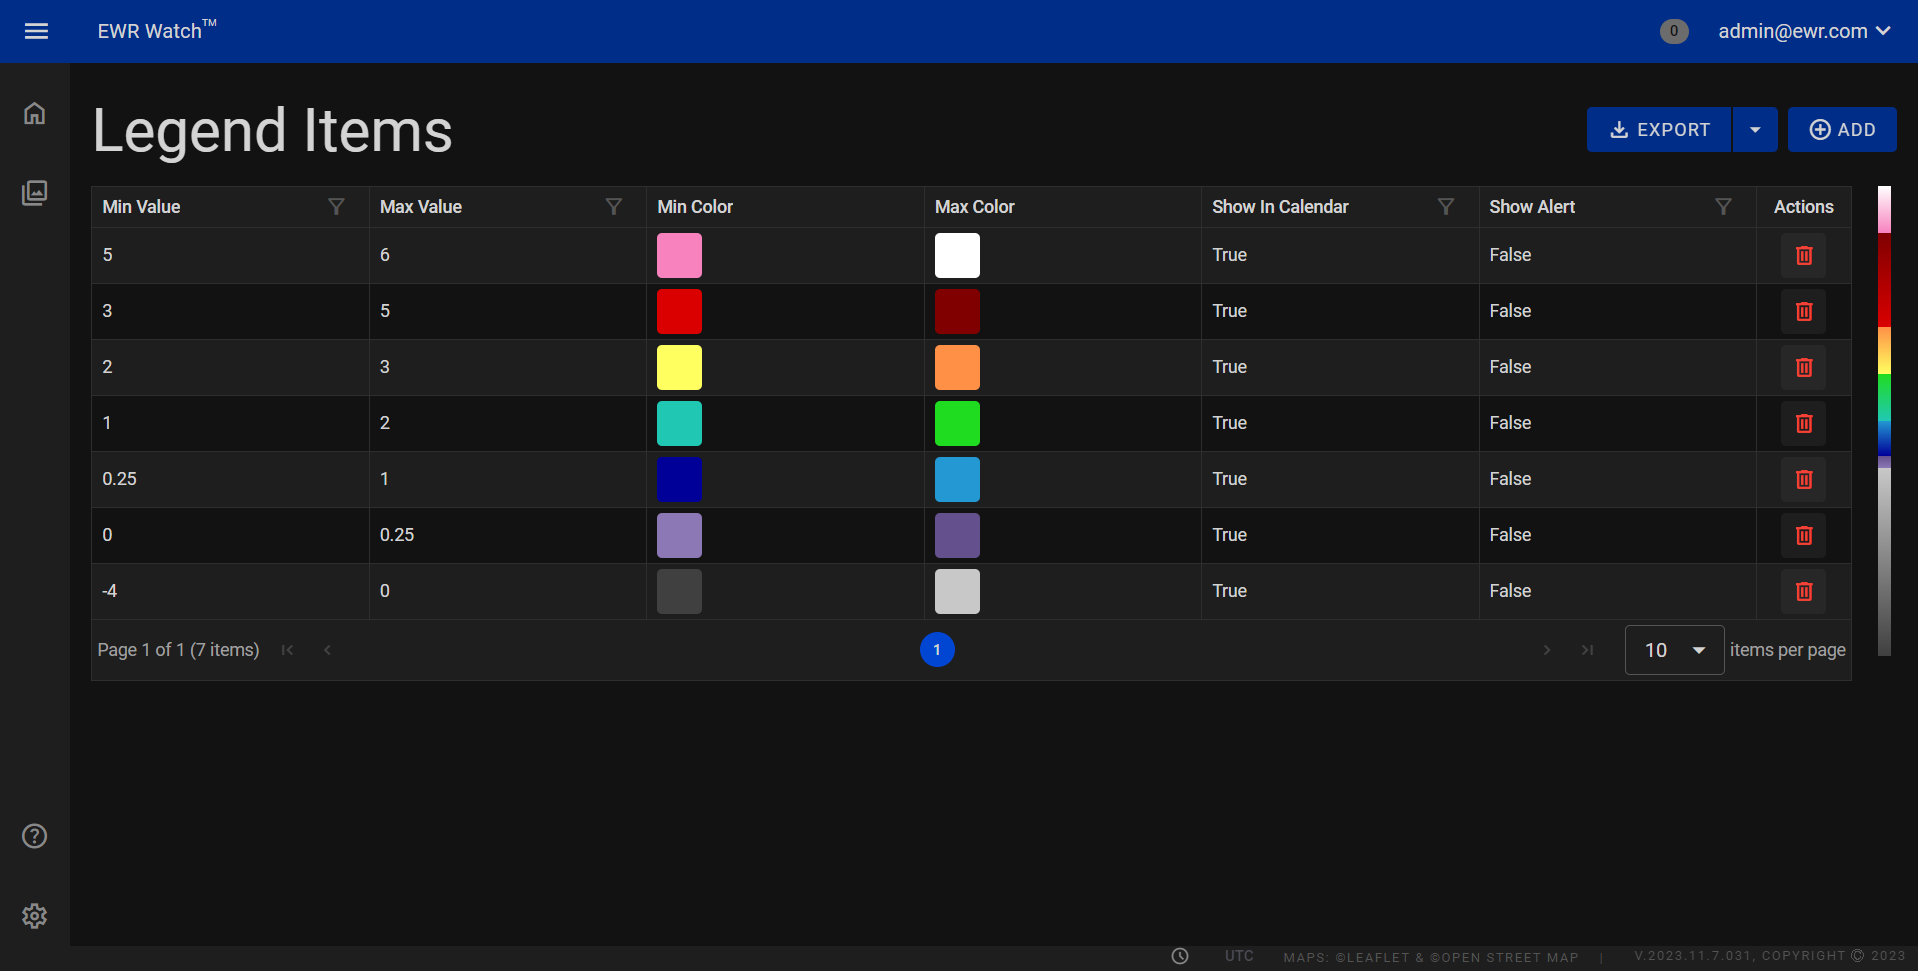
The central element of the Legend Items Page is the data grid, which presents information in a structured and organized manner. The grid consists of several columns, including:
Columns
-
Min Value
Represents the minimum threshold value for the data range. -
Max Value
Signifies the maximum threshold value for the data range. -
Min Color
Indicates the color associated with the minimum threshold value. -
Max Color
Represents the color corresponding to the maximum threshold value. -
Show in Calendar
Allows users to toggle the visibility of the legend item on the calendar view. -
Show Alert
Enables users to set up alerts for specific data ranges, enhancing proactive monitoring. -
Actions
Provides an actions column containing a delete button for easy removal of legend items.
Actions
- Delete
Clicking Delete removes the respective Legend Item from the system. This action is useful when retiring old legends and decluttering the interface. Users can confidently remove redundant or obsolete legend items, streamlining the application's management process.
Adding
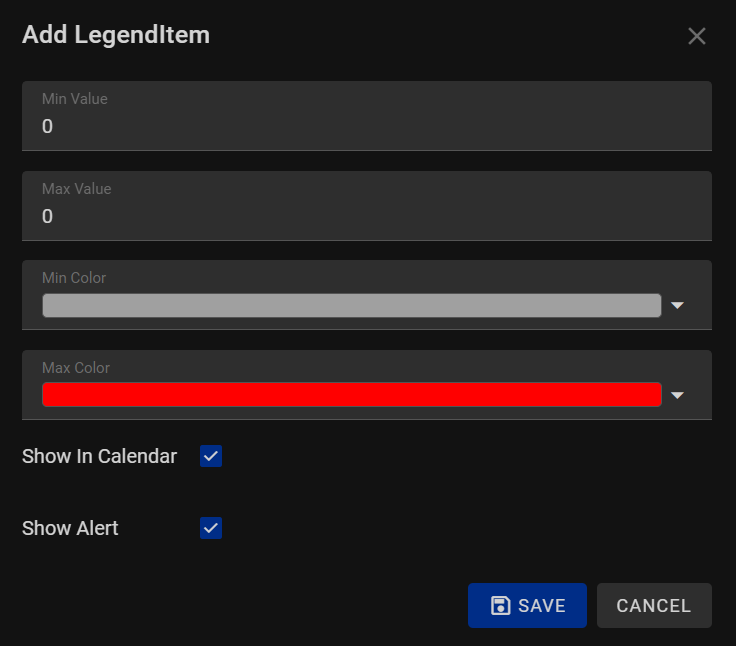
The Add button serves as a quick entry point for users to create new legend items. By clicking this button, users can input the minimum and maximum values, assign corresponding colors, specify visibility on the calendar, and set up alerts—all within an intuitive interface. These are the options:
-
Min Value and Max Value
Specify the minimum and maximum threshold values that define the data range for which you want to create a legend item. These values help categorize and visualize data effectively. -
Min Color and Max Color
Choose the colors that represent the minimum and maximum threshold values, respectively. Assigning distinct colors to different data ranges enhances the visual distinction on the calendar, making it easier to identify specific ranges at a glance. -
Show in Calendar
Enable this checkbox to display the legend item on the calendar view. When checked, the legend item will be visible, ensuring that the defined data range is clearly represented on the calendar interface. -
Show Alert
Activate this checkbox to set up alerts for the specified data range. Alerts provide notifications or warnings when the data within the defined range meets certain conditions, allowing users to stay informed and respond promptly to critical events or changes in the data.
Editing
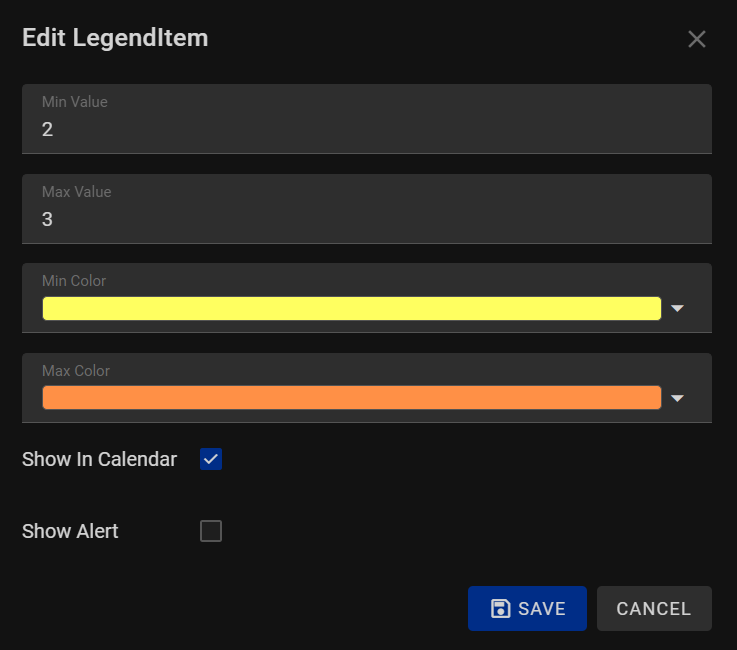
To edit a legend item, locate the item you want to modify within the Legend Items Page. Typically, this page provides an overview of all existing legend items. Identify the item you wish to edit, and select the appropriate edit option, often represented by an edit icon or an "Edit" button next to the legend item entry.
-
Min Value and Max Value
Adjust the minimum and maximum threshold values defining the data range for the legend item. -
Min Color and Max Color
Change the colors associated with the minimum and maximum threshold values to customize the visual representation on the calendar. -
Show in Calendar
Toggle the visibility of the legend item on the calendar view by checking or unchecking this option. -
Show Alert
Modify alert settings associated with the legend item, including notification conditions and alert triggers.
Exporting
Allows users to export the current Radar list in two formats: CSV (Comma-Separated Values) and Excel. This feature facilitates easy data sharing and analysis by providing options suitable for various applications.